RACP Divisional Written Exam · FRACP

Clinical Epidemiology for the written exam

Everything Physify has for Clinical Epidemiology: short lessons written to Australian guidance, exam-style questions with a worked explanation for each, and Bedside, our AI tutor, under every one. Try a question below, no sign-up.

courses
6courses
lessons
38lessons
exam-style questions
194exam-style questions
figures in the lessons
4figures in the lessons

Try one now · no sign-up

Clinical Epidemiology

A 58 year old woman has CT for renal colic, which shows a 2.4 cm homogeneous left adrenal mass with an unenhanced attenuation of 4 Hounsfield units. Blood pressure is 128/78 mmHg, potassium 4.2 mmol/L, and she has no features of Cushing syndrome. What is the most appropriate next step?

Pick an answer to see the explanation

What's covered

6 courses, each a set of lessons with a quiz after them. The bar shows how many questions each has. Open a course to see its lesson outline.

From the lessons

4 figures sit in the Clinical Epidemiology lessons: ECGs, diagrams, films and clinical images, each with what to look for. Here are 2. Tap one to enlarge it.
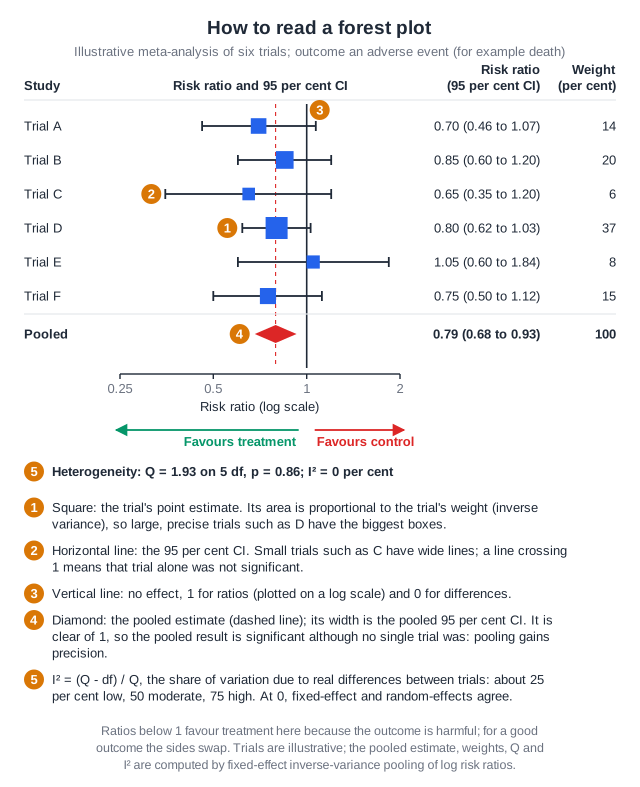
An illustrative forest plot of six trials with a harmful outcome such as death, risk ratios on a log scale from 0.25 to 2. Each trial is a blue square at its point estimate, with area proportional to its inverse-variance weight, on a horizontal line showing its 95 per cent confidence interval; trial D, the largest, carries 37 per cent of the weight and trial C, the smallest, 6 per cent with the widest interval. Every trial's interval crosses the vertical line of no effect at 1. The pooled fixed-effect estimate is a red diamond at 0.79, its width the pooled interval of 0.68 to 0.93, which is clear of 1, so pooling gives a significant result although no single trial was. Ratios below 1 favour treatment and above 1 favour control. Heterogeneity is Q 1.93 on 5 degrees of freedom, p 0.86, with I squared 0 per cent, so fixed-effect and random-effects models agree. A key explains I squared as (Q minus df) / Q, about 25 per cent low, 50 moderate and 75 high, and that the null is 1 for ratios and 0 for differences.
Physify teaching diagram. Tap the image to zoom.

From the lesson “Meta-Analysis, Heterogeneity and Publication Bias” in Biostatistics & Evidence-Based Medicine
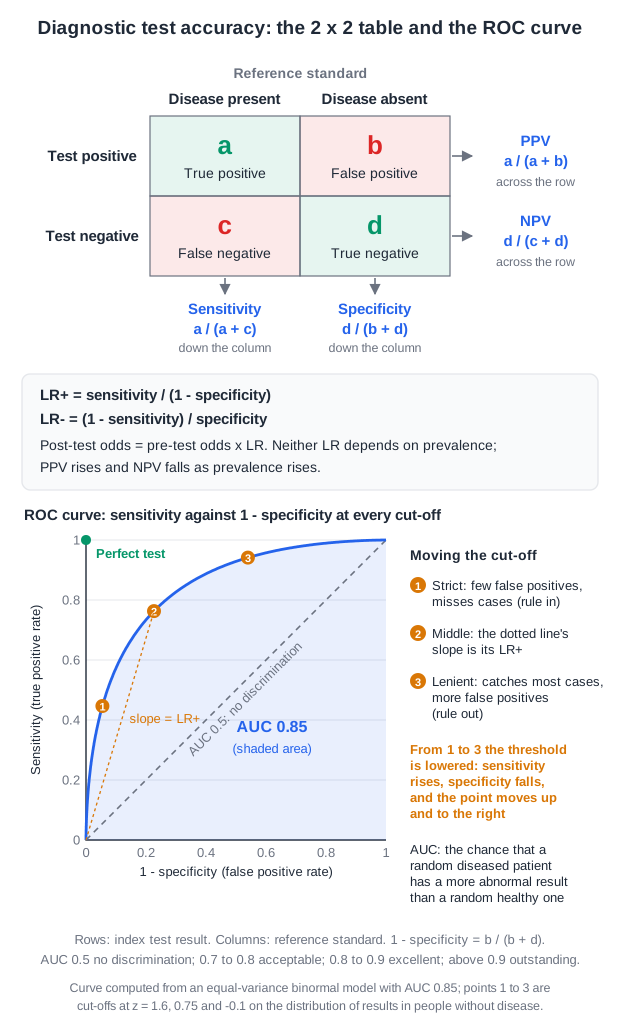
A 2 x 2 table with the reference standard in the columns (disease present, disease absent) and the index test in the rows (positive, negative): a true positives, b false positives, c false negatives, d true negatives. Sensitivity a / (a + c) and specificity d / (b + d) are read down the columns; positive predictive value a / (a + b) and negative predictive value d / (c + d) across the rows. LR+ is sensitivity / (1 - specificity) and LR- is (1 - sensitivity) / specificity. Below, an ROC curve plots sensitivity against 1 - specificity: the diagonal is a test with no discrimination and an area under the curve of 0.5, a good test bows towards the top left corner with an area of 0.85, and three cut-offs show that lowering the threshold moves the point up and to the right, raising sensitivity and lowering specificity. The slope of a line from the origin to a point is the LR+ at that cut-off.
Physify teaching diagram. Tap the image to zoom.

From the lesson “Continuous Results, Thresholds, Decisions and Agreement” in Diagnostic Tests and Probabilistic Reasoning

Free for Clinical Epidemiology

Open all of Clinical Epidemiology

A membership opens every lesson and all 194 Clinical Epidemiology questions, with the rest of the bank (11,500+ questions across 17 specialties), 15 timed mock exams, smart review and a daily plan to your exam.

The trial needs a card; cancel any time before it ends and you pay nothing. The free account needs no card.

Other specialties

Physify is a study aid for exam preparation only. It is not medical advice and must not be used to guide the care of any patient. Terms